Instacart Basket Analysis

Background
The Instacart stakeholders are interested in the variety of customers in their database along with their purchasing behaviors. They are considering a targeted marketing strategy and want to ensure they are maximizing the campaign’s effectiveness.
Objective
Utilize Instacart customer and sales databases to identify different types of customers and their habits.
Present findings to Instacart stakeholders utilizing visualizations created in Python and Tableau
Context
This project was created as a part of the Career Foundry data analytics program. It utilizes Excel and Python as tools for exploratory data analysis and Tableau as a data visualization tool for presenting the information to stakeholders.
Data Sets

Steps
Clean and wrangle data sets
Combine, group and aggregate data
customer, product, and order data
Derive new variables
Customer loyalty, frequency of orders
Aggregating data
Record changes and derivations across all stages of cleaning for consistency
Track flow of data during merges


Perform EDA of customer, product, and ordering data
Identify and understand underperforming areas of the business
Search for trends
Explore connections between variables


10 Key Questions and Recommendations
1- What differences can you find in ordering habits of different customer profiles?
I found that customers with higher incomes tend to buy the most on Friday and people with more dependents tend to spend most on Mondays.
Since number of dependents is consistent throughout all demographics (seen in question 9), this indicates that people with dependents that are making purchases on Monday are likely low or middle income.
Therefore, lower priced family-focused items should be advertised on Mondays.
Items from the snack department (the lowest cost department on average) would be ideal.
Sale items in popular departments -produce, dairy / eggs.
2- The sales team needs to know what the busiest days of the week and hours of the day are (i.e., the days and times with the most orders) in order to schedule ads at times when there are fewer orders.
The busiest days of the week are Saturday and Sunday, the busiest times of day are 9AM - 3PM.
3- The marketing team also want to know whether there are particular times of the day when people spend the most money, as this might inform the type of products they advertise at these times.
Prices appear to be negatively correlated with the amount of orders throughout the day.
Advertise items with lower prices / “ways to save” during busy hours
Sell higher priced items / boutique goods during slower times.
4- Instacart has a lot of products with different price tags. Marketing and sales want to use simpler price range groupings to help direct their efforts.
Prices can be aggregated generally into three categories - low-cost (<$5), mid-cost ($5-15) , and high-cost (>$15)
5- Are there certain types of products that are more popular than others? The marketing and sales teams want to know which departments have the highest frequency of product orders.
Products labeled “produce” are by far the biggest movers, selected nearly twice as much as any other products.
6- What’s the distribution among users in regards to their brand loyalty (i.e., how often do they return to Instacart)?
Customers are distributed into three categories with regular customers being the largest share of orders overall.
New customers - less than 10 orders with Instacart
Regular customers - between 10 and 40 orders
Loyal customers - more than 40 orders
Most customers are regular customers, accounting for a little less than half of all orders.
7- Are there differences in ordering habits based on a customer's loyalty status?
Loyal customers spend less than other customers and regular customers spend the most.
The difference in spending level is marginal.
8- Are there differences in ordering habits based on a customer's region?
Customers in the South spend more on average while Northeast customers spend the least.
‘
9- What different classifications does the demographic information suggest?
The represented demographics primarily split along age and income lines.
People with dependents do not appear to order different products from people without dependents.
Younger people spend less, seniors spend more.
Income level and age are positively correlated.
Youth - less than 22 years old
Young adult - 23-35
Adult - 36-61
Senior - 62+
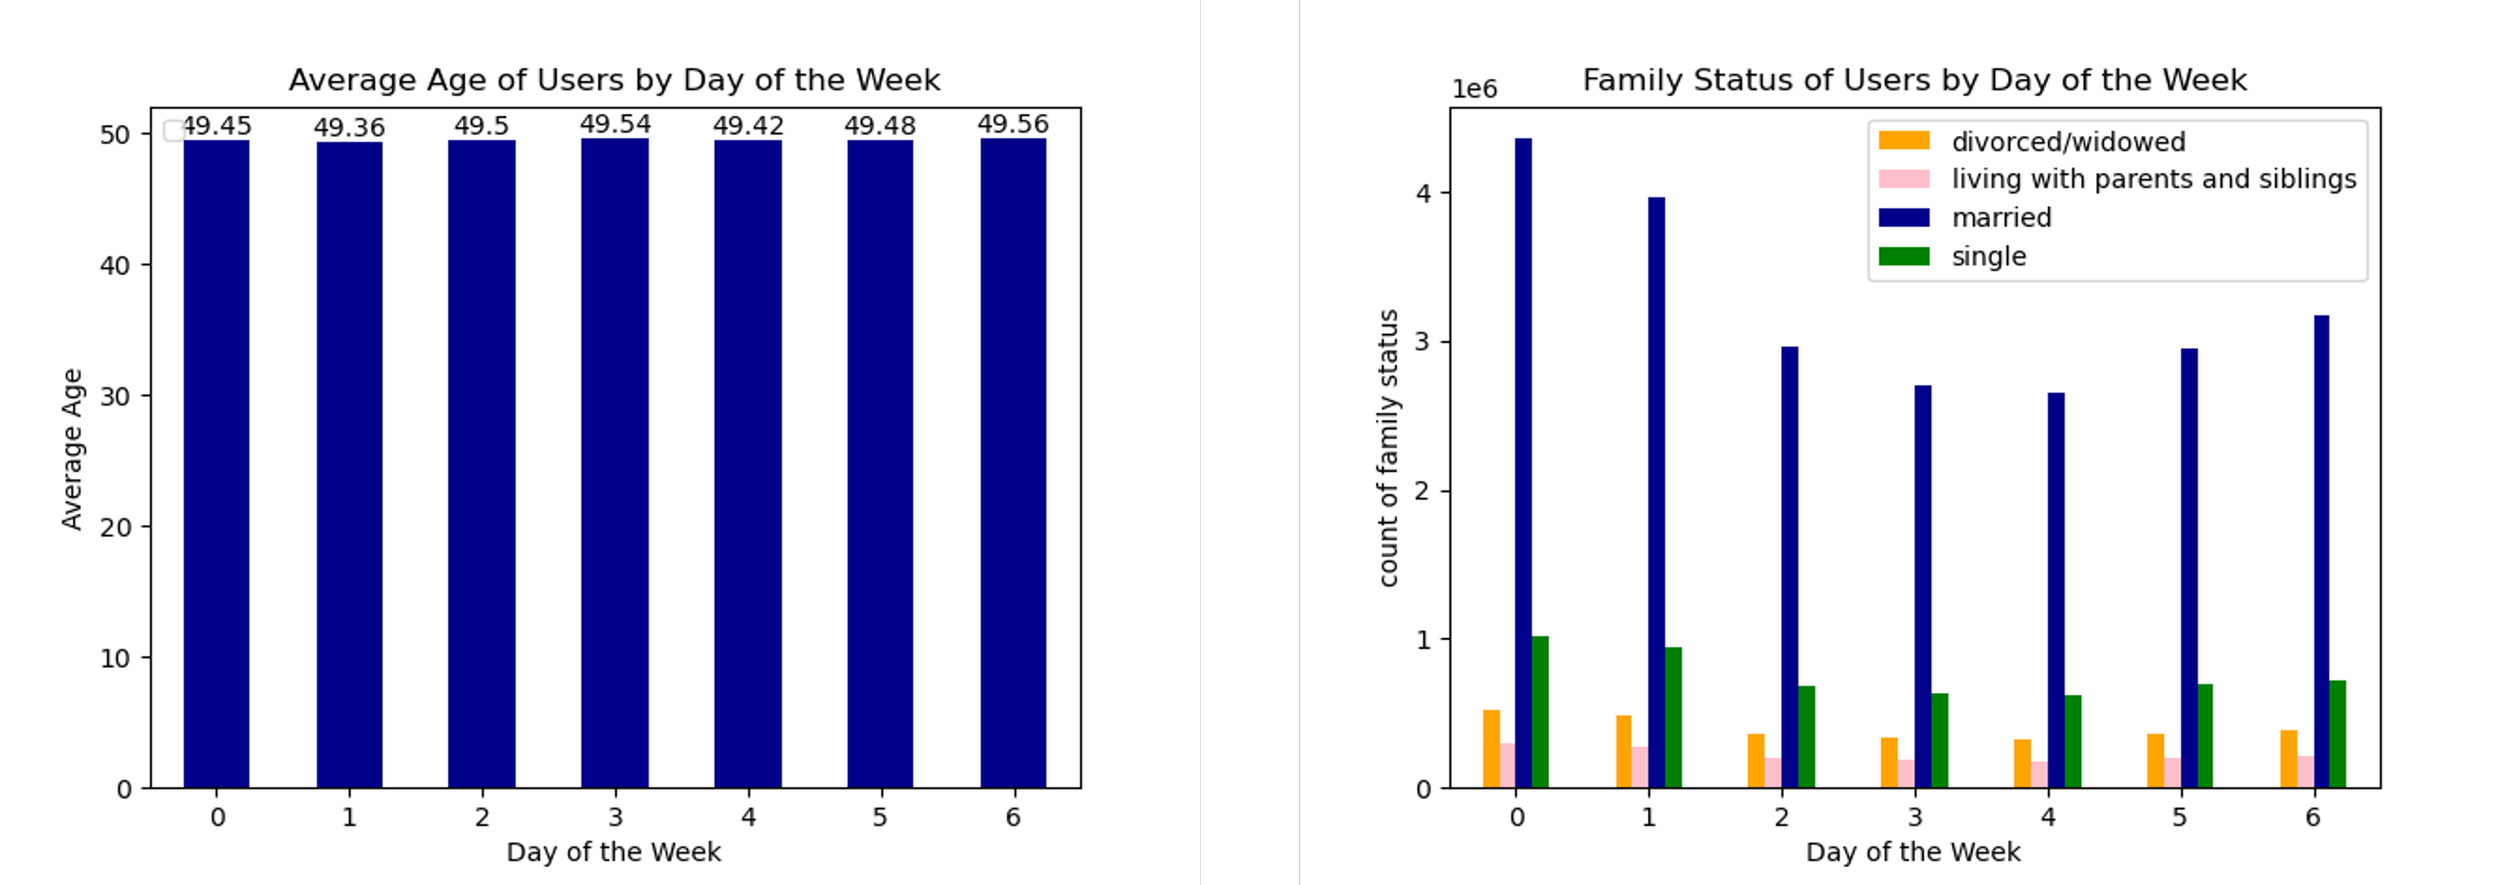
10- Is there a connection between age and family status in terms of ordering habits?
Seniors are far more likely to be divorced/widowed, while younger people account for the entire “single” demographic.
We can assume from the results of Question 9 that people who are divorced/widowed are more likely to spend more.
User age is consistent throughout the week, indicating that customers of all ages purchase at the same intervals throughout the day and week.
Orders broken down by family status are consistent with the general population in regards of the day of the week the order was placed.